Data Services

Web applications & Interactive Maps

Creating animated maps, data dashboards and visualizations for web & mobile devices to help you explore your data and highlight new insights

Data analytics & Visualization

Data science from start to finish -- tidying and processing data, predictive analytics, machine learning and visualization to help you make sense of your data

Spatial Analysis & Mapping

Specializing in geographic data analysis including GIS, geoprocessing, spatial modeling and spatial data visualization

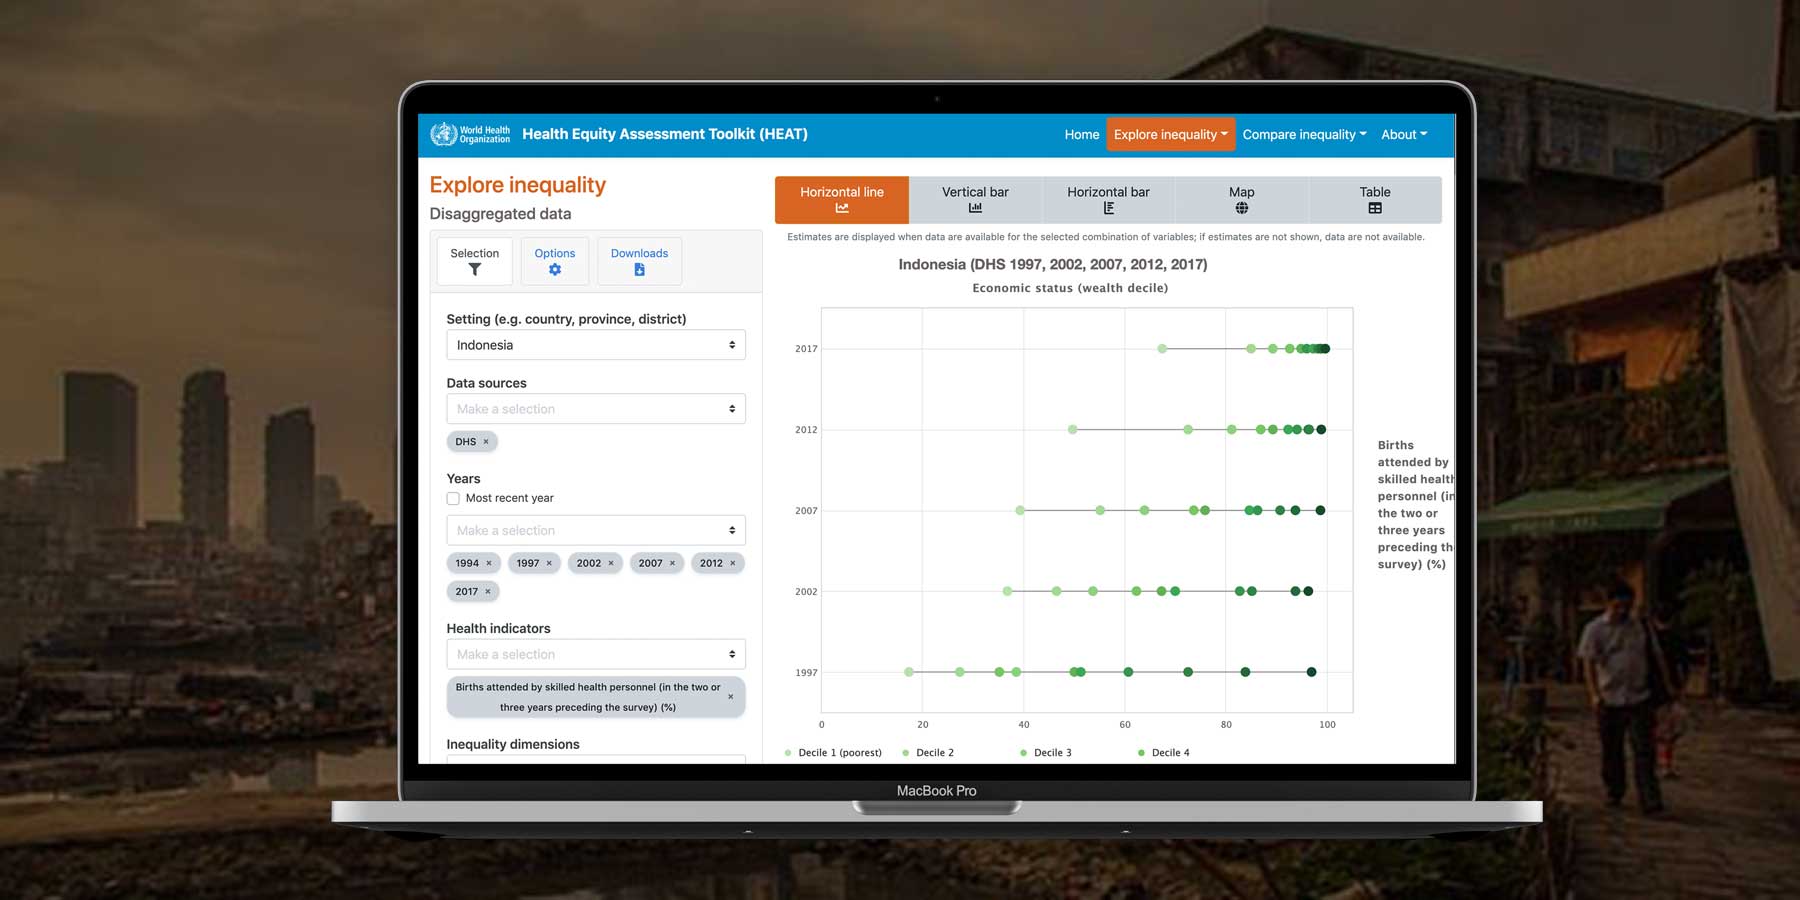
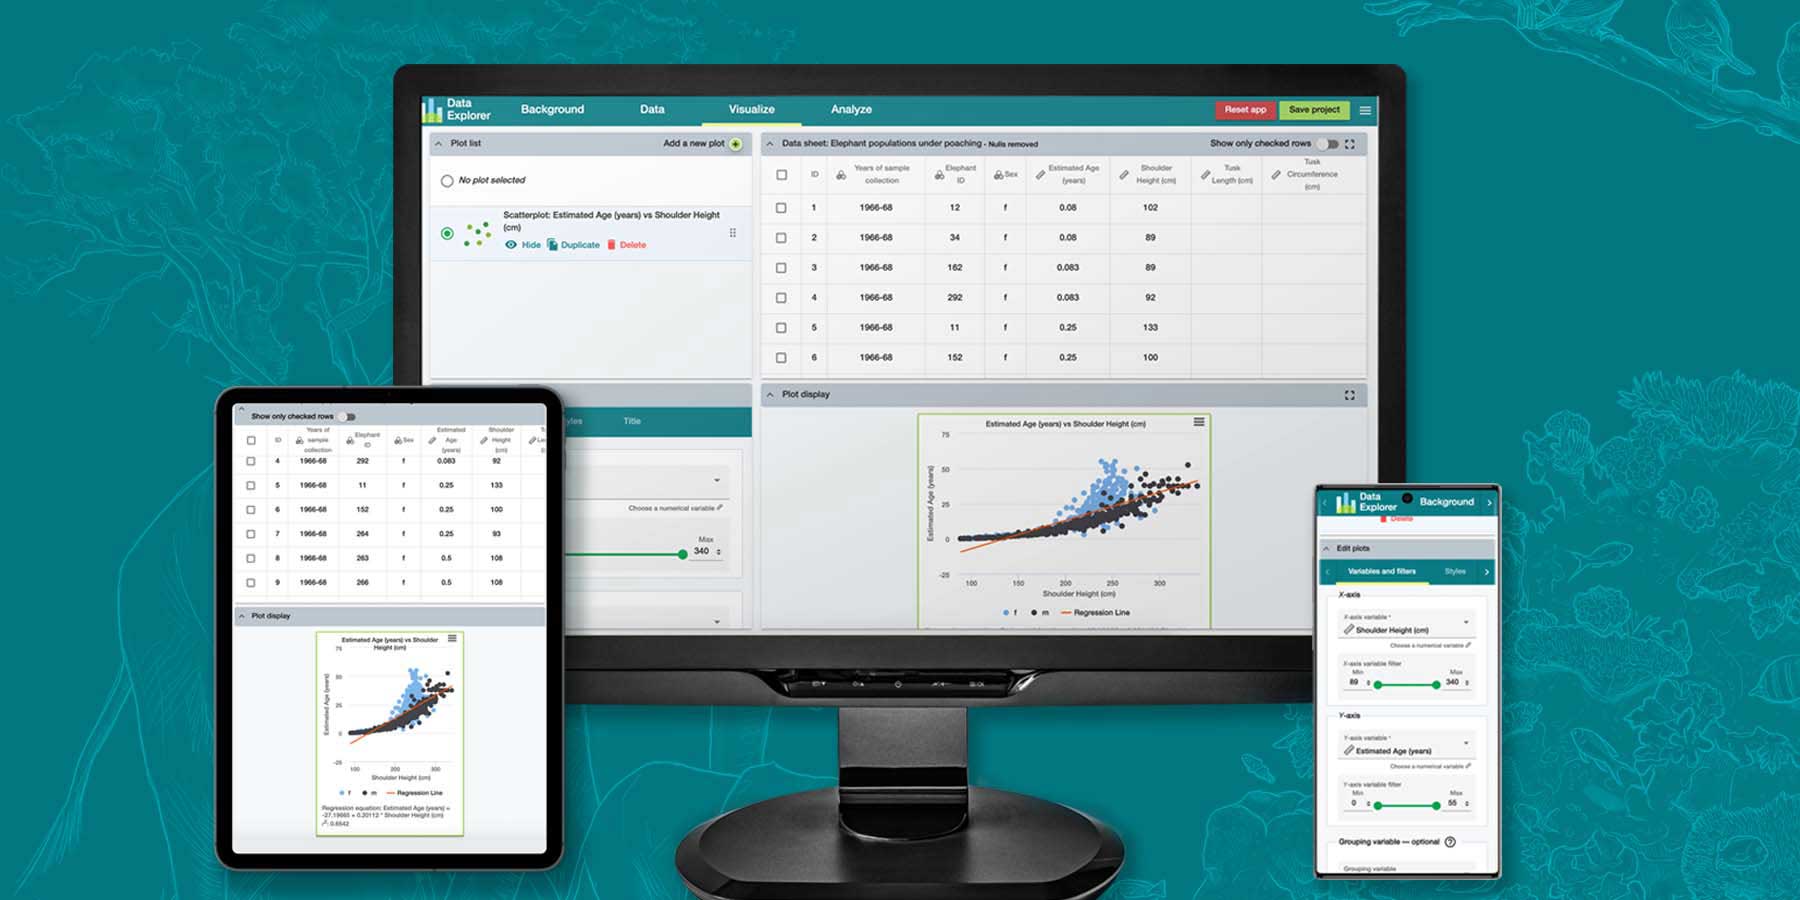
R/Shiny Applications

Developing Shiny web applications and dashboards for biotech companies, non-profits and educational institutions

Backend Development

Building robust backend systems and APIs including Python, Node.js, Docker, and database management

We love to create custom Mapbox maps

Portfolio

Some Examples of Projects We've Worked On

See how we've helped our clients >

A sample of our clients

What we do

Developers of interactive maps, custom analytics and data visualization

R, Python, PostgreSQL, PostGIS, React, Mapbox, Highcharts, ArcGIS/QGIS, D3, Shiny, Node.js, Angular, Vue.js, Google Maps API, Typescript

Built with the tools we love

R, Python, PostgreSQL, PostGIS, React, Mapbox, Highcharts, ArcGIS/QGIS, D3, Shiny, Node.js, Angular, Vue.js, Google Maps API, Typescript


learn more about us >