Web application for the Economic Innovation Group
An application to highlight areas experiencing persistent poverty
The project
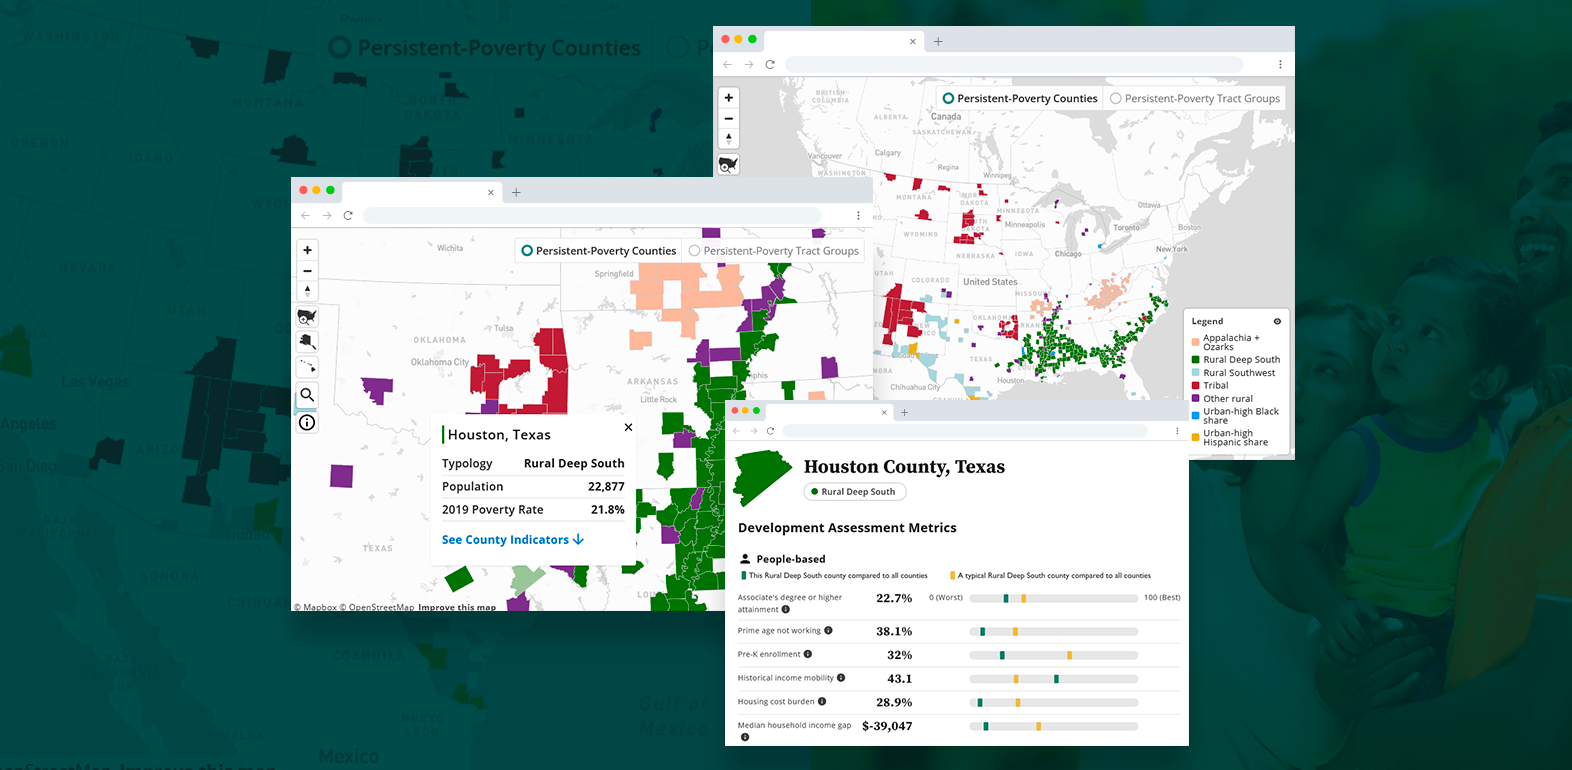
We developed a web application for the Economic Innovation Group that allows users explore a map of perisistent-poverty communities and their performance on key measure of economic development.
Our role
We built the tool from start to finish including design and development of the map and plots. The tool shows areas that experience persistent poverty at the county level and for groupings of Census tracts. We developed custom linear gauge (i.e., thermometer) charts to contextualize assessment metrics such as median household income, access to broadband, and pre-k enrollment. The application was released as part of a report entitled "Advancing Economic Development in Persistent-Poverty Communities".
Features of the work
- The data was prepared using R
- The tool is built using React and Typescript
- The map was generated using Mapbox API
- The application was developed as a web component so it could be easily integrated into the client's website
Tools used

React

R

Mapbox

Typescript