Web application to monitor trends in mortality data for the World Health Organization
A web application to show quality and trends in cause-of-death data
The project
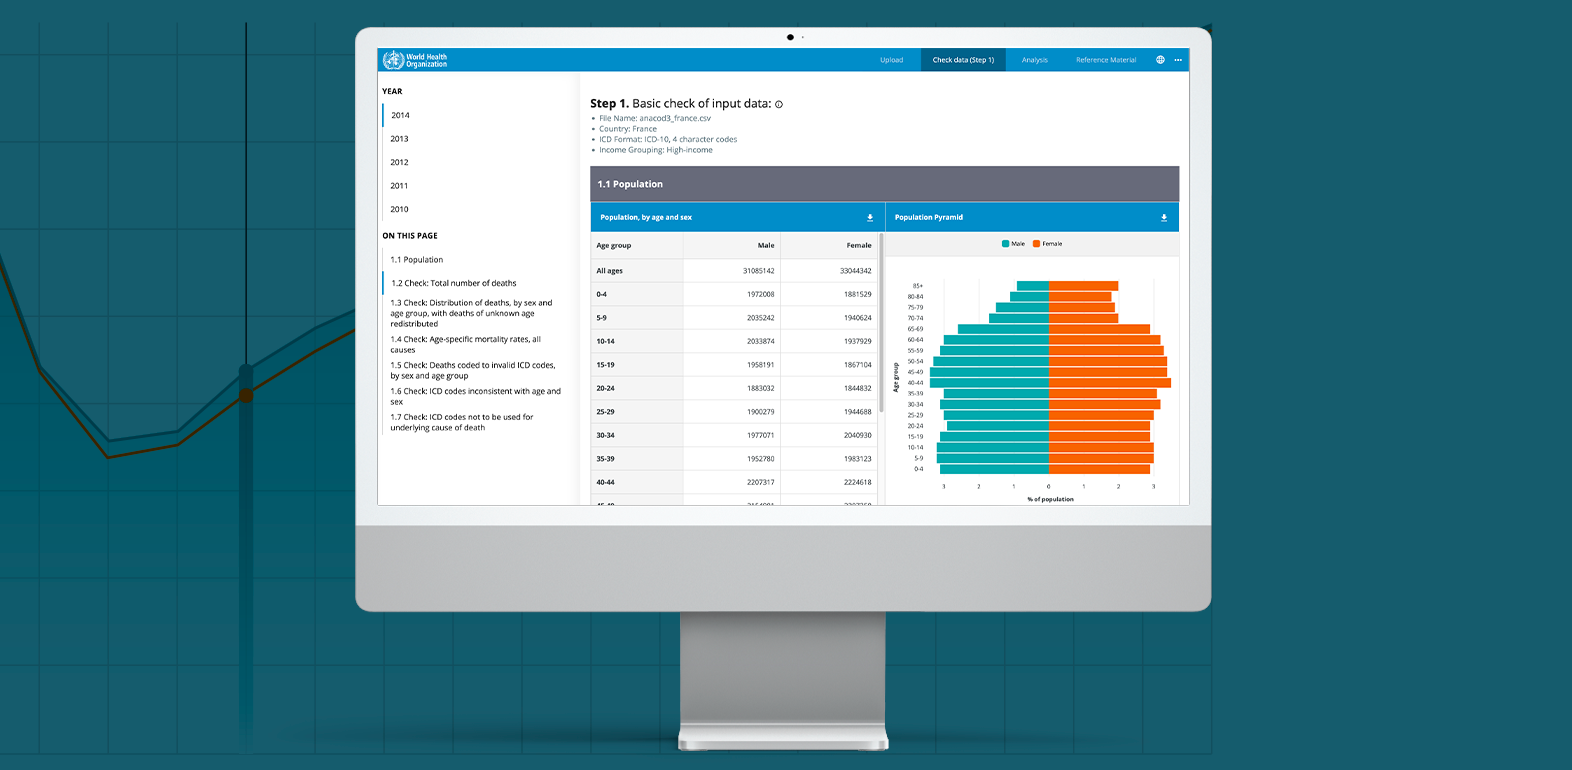
We developed an extensive data dashboard for the World Health Organization to allow users to perform a comprehensive and systematic analysis of mortality and cause-of-death data. The tool automatically tabulates data and presents basic mortality measures in tables and figures.
Our role
We built the tool from start to finish -- from design to deployment. We created both a front-end application and a backend server and database to feed the application with detailed data for dozens of charts and tables shown in the application.
Features of the work
- We wrote the application using React with Typescript
- We created the server and database (PostgreSQL) that power the application
- We used Azure Web Services to host the application
Tools used

React

Typescript

Postgres

Highcharts
Made for
