Technical Tidbits From Spatial Analysis & Data Science

Menu

Skip to content
  • Home
  • Intro R workshop
  • Spatial R workshop
  • Machine Learning R workshop
  • Home
  • Data Solutions
  • Training
  • Research
  • About Us
  • Tech Blog
  • Contact us

Month: October 2021

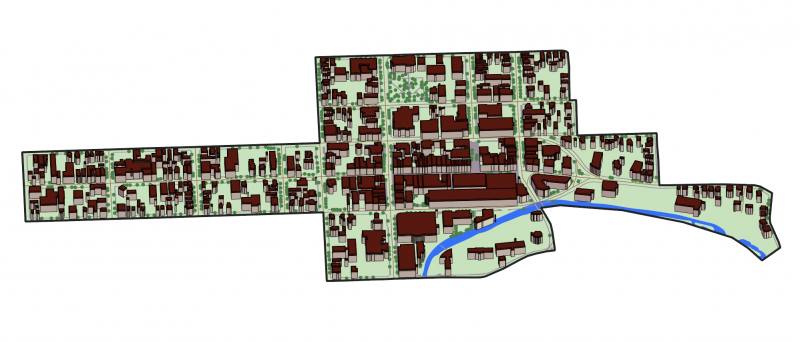
Create a stylized map of a real city using QGIS and Illustrator

Posted on October 18, 2021 by Sara DeLessio · Leave a comment

Your city is hosting a renaissance faire and the planning committee has come to you asking for a stylized map of the downtown. The map needs to include accurate buildings, streets, natural features, and sidewalks. Your first idea might be to trace the map using satellite imagery, and while this is doable, tracing 200 buildings […]

Continue reading →
We can help!

We specialize in data analytics, interactive maps, data visualization and Shiny applications.

Learn more about us

Search blog posts

Subscribe to new posts by email

Follow us on twitter

Follow @zevross
My Tweets

Categories

  • D3
  • Data Visualization
  • Database
  • GDAL
  • ggplot2
  • GIS/Maps
  • Graphic Design
  • JavaScript
  • LeafletJS
  • Markdown
  • PostGIS
  • PostgreSQL
  • Python
  • R
  • Regular Expressions
  • Shiny
  • Spatial
  • Uncategorized
  • Web Development
  • Web Mapping

Recent Comments

  • run3.pro on Easy multi-panel plots in R using facet_wrap() and facet_grid() from ggplot2
  • GS on Predictive modeling and machine learning in R with the caret package
  • Rodrigo on Using the R function anti_join to find unmatched records
  • Dev on Mapping in R using the ggplot2 package
  • fio on Map and analyze raster data in R
© 2025 Technical Tidbits From Spatial Analysis & Data Science
Powered by WordPress & Themegraphy
ZevRoss Spatial
Analysis
209 N. Aurora St, 2nd Floor
Ithaca, NY 14850
607-277-0004

info@zevross.com