Create a stylized map of a real city using QGIS and Illustrator
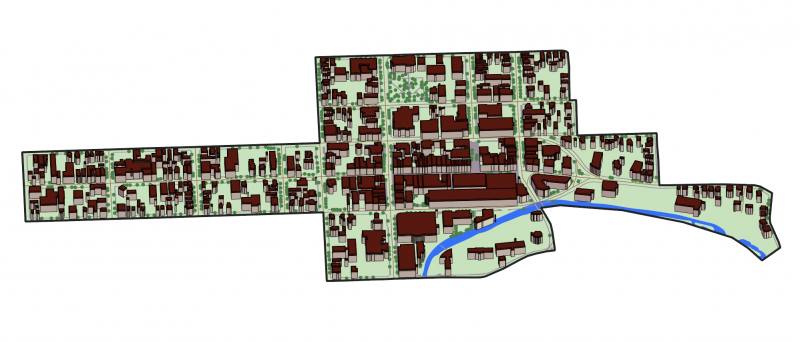
Your city is hosting a renaissance faire and the planning committee has come to you asking for a stylized map of the downtown. The map needs to include accurate buildings, streets, natural features, and sidewalks. Your first idea might be to trace the map using satellite imagery, and while this is doable, tracing 200 buildings […]
Continue reading →